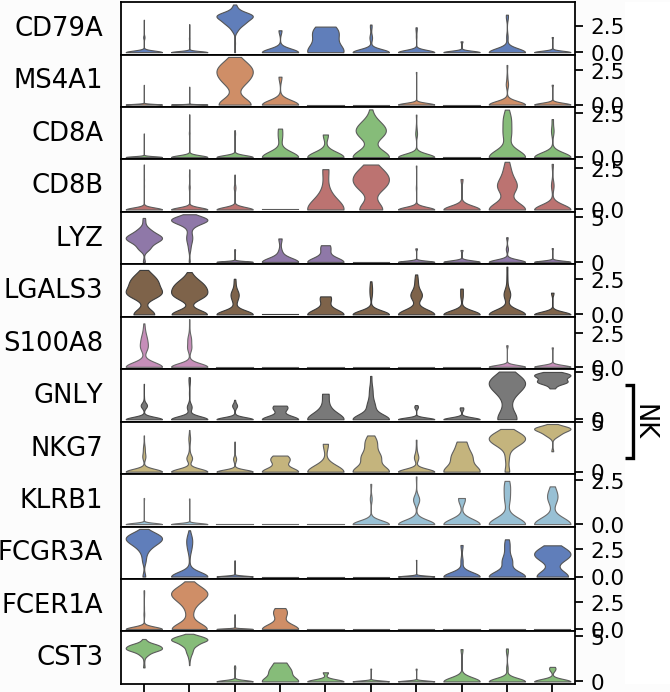
In scanpy, there is a function to create a stacked violin plot.
 There is no such function in
 Seurat, and many people were asking for this feature.
e.g. https://github.com/satijalab/seurat/issues/300
https://github.com/satija …
In scanpy, there is a function to create a stacked violin plot.
There is no such function in Seurat, and many people were asking for this feature.
e.g. https://github.com/satijalab/seurat/issues/300
https://github.com/satija …